Norway
Two centuries of Viking raids into Europe tapered off following the adoption of Christianity by King Olav TRYGGVASON in 994. Conversion of the Norwegian kingdom occurred over the next several decades. In 1397, Norway was absorbed into a union with Denmark that lasted more than four centuries. In 1814, Norwegians resisted the cession of their country to Sweden and adopted a new constitution. Sweden then invaded Norway but agreed to let Norway keep its constitution in return for accepting the union under a Swedish king.
Rising nationalism throughout the 19th century led to a 1905 referendum granting Norway independence. Although Norway remained neutral in World War I, it suffered heavy losses to its shipping. Norway proclaimed its neutrality at the outset of World War II, but was nonetheless occupied for five years by Nazi Germany (1940-45).
In 1949, neutrality was abandoned and Norway became a member of NATO. Discovery of oil and gas in adjacent waters in the late 1960s boosted Norway’s economic fortunes. In referenda held in 1972 and 1994, Norway rejected joining the EU. Key domestic issues include immigration and integration of ethnic minorities, maintaining the country’s extensive social safety net with an aging population, and preserving economic competitiveness.
Norwegian Flag
Geography
Location:
Northern Europe, bordering the North Sea and the North Atlantic Ocean, west of Sweden
Geographic coordinates:
62 00 N, 10 00 E
Map references:
Europe
Area:
total: 323,802 sq km
country comparison to the world: 68
land: 304,282 sq km
water: 19,520 sq km
Area – comparative:
slightly larger than New Mexico
Land boundaries:
total: 2,542 km
border countries: Finland 727 km, Sweden 1,619 km, Russia 196 km
Coastline:
25,148 km (includes mainland 2,650 km, as well as long fjords, numerous small islands, and minor indentations 22,498 km; length of island coastlines 58,133 km)
Maritime claims:
territorial sea: 12 nm
contiguous zone: 10 nm
exclusive economic zone: 200 nm
continental shelf: 200 nm
Climate:
temperate along coast, modified by North Atlantic Current; colder interior with increased precipitation and colder summers; rainy year-round on west coast
Terrain:
glaciated; mostly high plateaus and rugged mountains broken by fertile valleys; small, scattered plains; coastline deeply indented by fjords; arctic tundra in north
Elevation extremes:
lowest point: Norwegian Sea 0 m
highest point: Galdhopiggen 2,469 m
Natural resources:
petroleum, natural gas, iron ore, copper, lead, zinc, titanium, pyrites, nickel, fish, timber, hydropower
Land use:
arable land: 2.52%
permanent crops: 0.01%
other: 97.46% (2011)
Irrigated land:
1,149 sq km (2007)
Total renewable water resources:
382 cu km (2011)
Freshwater withdrawal (domestic/industrial/agricultural):
total: 2.94 cu km/yr (28%/43%/29%)
per capita: 622.4 cu m/yr (2006)
Natural hazards:
rockslides, avalanches
volcanism: Beerenberg (elev. 2,227 m) on Jan Mayen Island in the Norwegian Sea is the country’s only active volcano
Environment – current issues:
water pollution; acid rain damaging forests and adversely affecting lakes, threatening fish stocks; air pollution from vehicle emissions
Environment – international agreements:
party to: Air Pollution, Air Pollution-Nitrogen Oxides, Air Pollution-Persistent Organic Pollutants, Air Pollution-Sulfur 85, Air Pollution-Sulfur 94, Air Pollution-Volatile Organic Compounds, Antarctic-Environmental Protocol, Antarctic-Marine Living Resources, Antarctic Seals, Antarctic Treaty, Biodiversity, Climate Change, Climate Change-Kyoto Protocol, Desertification, Endangered Species, Environmental Modification, Hazardous Wastes, Law of the Sea, Marine Dumping, Ozone Layer Protection, Ship Pollution, Tropical Timber 83, Tropical Timber 94, Wetlands, Whaling
signed, but not ratified: none of the selected agreements
Geography – note:
about two-thirds mountains; some 50,000 islands off its much-indented coastline; strategic location adjacent to sea lanes and air routes in North Atlantic; one of the most rugged and longest coastlines in the world
People & Society
Nationality:
noun: Norwegian(s)
adjective: Norwegian
Ethnic groups:
Norwegian 94.4% (includes Sami, about 60,000), other European 3.6%, other 2% (2007 estimate)
Languages:
Bokmal Norwegian (official), Nynorsk Norwegian (official), small Sami- and Finnish-speaking minorities
note: Sami is an official language in nine municipalities
Religions:
Church of Norway (Evangelical Lutheran – official) 82.1%, other Christian 3.9%, Muslim 2.3%, Roman Catholic 1.8%, other 2.4%, unspecified 7.5% (2011 est.)
Population:
5,147,792 (July 2014 est.)
country comparison to the world: 121
Age structure:
0-14 years: 18.2% (male 480,176/female 456,128)
15-24 years: 13.1% (male 347,873/female 329,021)
25-54 years: 40.8% (male 1,080,339/female 1,021,370)
55-64 years: 16.1% (male 305,094/female 298,134)
65 years and over: 16.8% (male 375,909/female 453,748) (2014 est.)
Dependency ratios:
total dependency ratio: 53.2 %
youth dependency ratio: 28.5 %
elderly dependency ratio: 24.7 %
potential support ratio: 4.1 (2014 est.)
Median age:
total: 39.1 years
male: 38.2 years
female: 39.9 years (2014 est.)
Population growth rate:
1.19% (2014 est.)
country comparison to the world: 101
Birth rate:
12.09 births/1,000 population (2014 est.)
country comparison to the world: 165
Death rate:
8.19 deaths/1,000 population (2014 est.)
country comparison to the world: 93
Net migration rate:
7.96 migrant(s)/1,000 population (2014 est.)
country comparison to the world: 18
Urbanization:
urban population: 79.4% of total population (2011)
rate of urbanization: 1.03% annual rate of change (2010-15 est.)
Major urban areas – population:
OSLO (capital) 915,000 (2011)
Sex ratio:
at birth: 1.06 male(s)/female
0-14 years: 1.05 male(s)/female
15-24 years: 1.06 male(s)/female
25-54 years: 1.06 male(s)/female
55-64 years: 1.01 male(s)/female
65 years and over: 0.78 male(s)/female
total population: 0.98 male(s)/female (2014 est.)
Mother’s mean age at first birth:
28.5
note: data is calculated based on actual age at first births (2012 est.)
Maternal mortality rate:
7 deaths/100,000 live births (2010)
country comparison to the world: 167
Infant mortality rate:
total: 2.48 deaths/1,000 live births
country comparison to the world: 221
male: 2.79 deaths/1,000 live births
female: 2.15 deaths/1,000 live births (2014 est.)
Life expectancy at birth:
total population: 81.6 years
country comparison to the world: 17
male: 79.63 years
female: 83.69 years (2014 est.)
Total fertility rate:
1.86 children born/woman (2014 est.)
country comparison to the world: 145
Contraceptive prevalence rate:
88.4%
note: percent of women aged 20-44 (2005)
Health expenditures:
9.1% of GDP (2011)
country comparison to the world: 42
Physicians density:
3.7 physicians/1,000 population (2011)
Hospital bed density:
3.3 beds/1,000 population (2010)
Drinking water source:
improved:
urban: 100% of population
rural: 100% of population
total: 100% of population
unimproved:
urban: 0% of population
rural: 0% of population
total: 0% of population (2011 est.)
Sanitation facility access:
improved:
urban: 100% of population
rural: 100% of population
total: 100% of population
unimproved:
urban: 0% of population
rural: 0% of population
total: 0% of population (2011 est.)
HIV/AIDS – adult prevalence rate:
0.1% (2009 est.)
country comparison to the world: 164
HIV/AIDS – people living with HIV/AIDS:
4,000 (2009 est.)
country comparison to the world: 127
HIV/AIDS – deaths:
fewer than 100 (2009 est.)
country comparison to the world: 136
Obesity – adult prevalence rate:
21.5% (2008)
country comparison to the world: 84
Education expenditures:
6.9% of GDP (2010)
country comparison to the world: 21
Literacy:
definition: age 15 and over can read and write
total population: 100%
male: 100%
female: 100%
School life expectancy (primary to tertiary education):
total: 18 years
male: 17 years
female: 18 years (2011)
Unemployment, youth ages 15-24:
total: 8.6%
country comparison to the world: 117
male: 10%
female: 7.2% (2012)
Government
Country name:
conventional long form: Kingdom of Norway
conventional short form: Norway
local long form: Kongeriket Norge
local short form: Norge
Government type:
constitutional monarchy
Capital:
name: Oslo
geographic coordinates: 59 55 N, 10 45 E
time difference: UTC+1 (6 hours ahead of Washington, DC, during Standard Time)
daylight saving time: +1hr, begins last Sunday in March; ends last Sunday in October
Administrative divisions:
19 counties (fylker, singular – fylke); Akershus, Aust-Agder, Buskerud, Finnmark, Hedmark, Hordaland, More og Romsdal, Nordland, Nord-Trondelag, Oppland, Oslo, Ostfold, Rogaland, Sogn og Fjordane, Sor-Trondelag, Telemark, Troms, Vest-Agder, Vestfold
Dependent areas:
Bouvet Island, Jan Mayen, Svalbard
Independence:
7 June 1905 (Norway declared the union with Sweden dissolved); 26 October 1905 (Sweden agreed to the repeal of the union)
National holiday:
Constitution Day, 17 May (1814)
Constitution:
drafted spring 1814, adopted 16 May 1814, signed by Constituent Assembly 17 May 1814; amended many times, last in 2012 (2012)
Legal system:
mixed legal system of civil, common, and customary law; Supreme Court can advise on legislative acts
International law organization participation:
accepts compulsory ICJ jurisdiction with reservations; accepts ICCt jurisdiction
Suffrage:
18 years of age; universal
Executive branch:
chief of state: King HARALD V (since 17 January 1991); Heir Apparent Crown Prince HAAKON MAGNUS, son of the monarch (born 20 July 1973)
head of government: Prime Minister Erna SOLBERG (since 16 October 2013)
cabinet: State Council appointed by the monarch with the approval of parliament
(For more information visit the World Leaders website Opens in New Window)
elections: the monarchy is hereditary; following parliamentary elections, the leader of the majority party or the leader of the majority coalition usually appointed prime minister by the monarch with the approval of the parliament
Legislative branch:
modified unicameral Parliament or Storting (169 seats; members elected by popular vote by proportional representation to serve four-year terms)
elections: last held on 9 September 2013 (next to be held in September 2017)
election results: percent of vote by party – Ap 30.8%, H 26.3%, FrP 16.3%, KrF 5.6%, Sp 5.5%, V 5.2%, SV 4.1%, MDG 2.8, other 2.7%; seats by party – Ap 55, H 48, FrP 29, Sp 10, KrF 10, V 9, SV 7, MDG 1
Judicial branch:
highest court(s): Supreme Court or Hoyesterett (consists of the chief justice and 18 associate justices)
note – in addition to professionally trained judges, there are elected lay judges that sit on the bench with professional judges in the Courts of Appeal and district courts
judge selection and term of office: justices appointed by the monarch (King in Council) upon the recommendation of the Judicial Appointments Board; justice retirement mandatory at age 70
subordinate courts: Courts of Appeal or Lagmensrett; regional and district courts; Conciliation Boards; ordinary and special courts
Political parties and leaders:
Center Party or Sp [Liv Signe NAVARSETE]
Christian Democratic Party or KrF [Knut Arild HAREIDE]
Conservative Party or H [Erna SOLBERG]
Labor Party or Ap [Jens STOLTENBERG]
Liberal Party or V [Trine SKEI-GRANDE]
Progress Party or FrP [Siv JENSEN]
Socialist Left Party or SV [Audun LYSBAKKEN]
Political pressure groups and leaders:
Confederation of Norwegian Enterprise (Naeringslivets Hovedorganisasjon) or NHO [President Tore ULSTEIN; CEO Kristin SKOGEN LUND]
Norwegian Confederation of Trade Unions (Landsorganisasjonen i Norge) or LO [Gerd KRISTIANSEN]
other: environmental groups; media; digital privacy movements
International organization participation:
ADB (nonregional member), AfDB (nonregional member), Arctic Council, Australia Group, BIS, CBSS, CD, CE, CERN, EAPC, EBRD, EFTA, EITI (implementing country), ESA, FAO, FATF, IADB, IAEA, IBRD, ICAO, ICC (national committees), ICRM, IDA, IEA, IFAD, IFC, IFRCS, IGAD (partners), IHO, ILO, IMF, IMO, IMSO, Interpol, IOC, IOM, IPU, ISO, ITSO, ITU, ITUC (NGOs), MIGA, MINUSMA, MONUSCO, NATO, NC, NEA, NIB, NSG, OAS (observer), OECD, OPCW, OSCE, Paris Club, PCA, Schengen Convention, UN, UNCTAD, UNESCO, UNHCR, UNIDO, UNITAR, UNMISS, UNRWA, UNTSO, UNWTO, UPU, WCO, WHO, WIPO, WMO, WTO, ZC
Diplomatic representation in the US:
chief of mission: Ambassador Kare Reidar AAS (since 22 August 2013)
chancery: 2720 34th Street NW, Washington, DC 20008
telephone: [1] (202) 333-6000
FAX: [1] (202) 469-3990
consulate(s) general: Houston, New York, San Francisco
Diplomatic representation from the US:
chief of mission: Ambassador (vacant); Charge d’Affaires Julie Furuta-Toy (since 27 September 2013)
embassy: Henrik Ibsens gate 48, 0244 Oslo; note – the embassy will move to Huseby in the near future
mailing address: PSC 69, Box 1000, APO AE 09707
telephone: [47] 21-30-85-40
FAX: [47] 22-44-33-63, 22-56-27-51
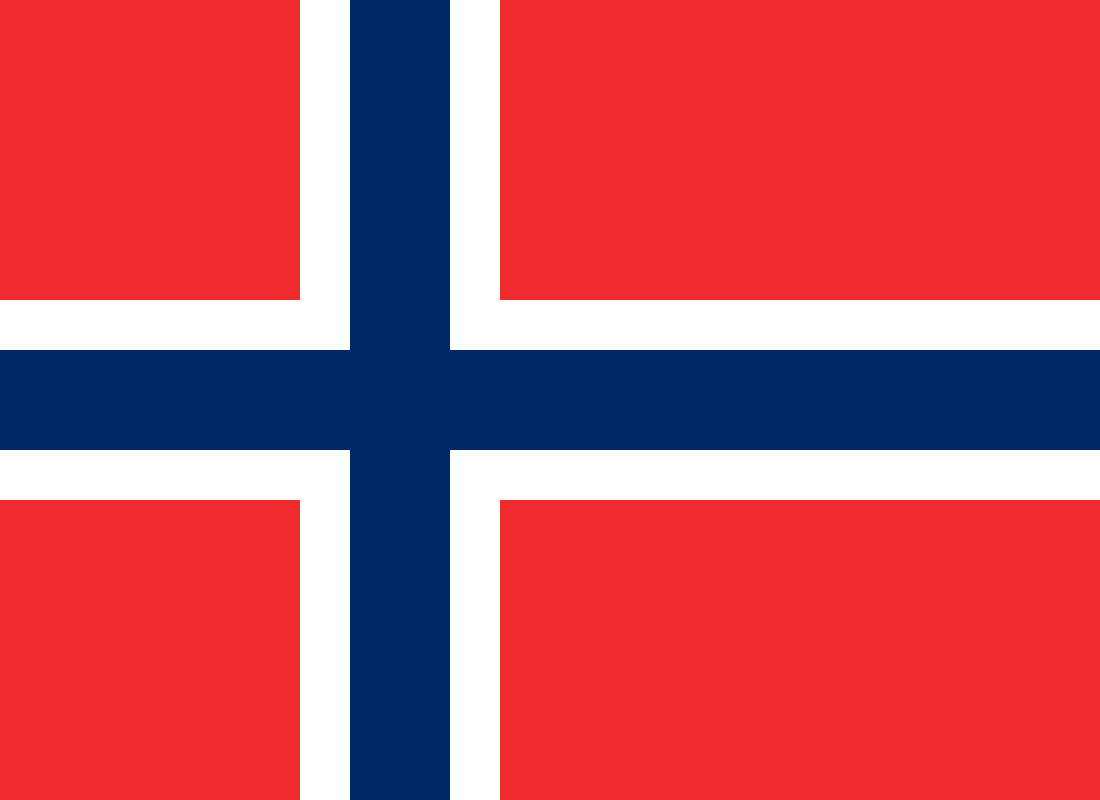
Flag description:
red with a blue cross outlined in white that extends to the edges of the flag; the vertical part of the cross is shifted to the hoist side in the style of the Dannebrog (Danish flag); the colors recall Norway’s past political unions with Denmark (red and white) and Sweden (blue)
National symbol(s):
lion
National anthem:
name: “Ja, vi elsker dette landet” (Yes, We Love This Country)
Economy
Economy – overview:
The Norwegian economy is a prosperous mixed economy, with a vibrant private sector, a large state sector, and an extensive social safety net. The government controls key areas, such as the vital petroleum sector, through extensive regulation and large-scale state-majority-owned enterprises. The country is richly endowed with natural resources – petroleum, hydropower, fish, forests, and minerals – and is highly dependent on the petroleum sector, which accounts for the largest portion of export revenue and about 30% of government revenue. Norway is the world’s third-largest natural gas exporter; and seventh largest oil exporter, making one of its largest offshore oil finds in 2011.
Norway opted to stay out of the EU during a referendum in November 1994; nonetheless, as a member of the European Economic Area, it contributes sizably to the EU budget. In anticipation of eventual declines in oil and gas production, Norway saves state revenue from the petroleum sector in the world’s largest sovereign wealth fund, valued at over $830 billion in January 2014 and uses the fund’s return to help finance public expenses. After solid GDP growth in 2004-07, the economy slowed in 2008, and contracted in 2009, before returning to positive growth in 2010-13. Nevertheless, the government budget remains in surplus.
GDP (purchasing power parity):
$282.2 billion (2013 est.)
country comparison to the world: 48
$277.8 billion (2012 est.)
$269.7 billion (2011 est.)
note: data are in 2013 US dollars
GDP (official exchange rate):
$515.8 billion (2013 est.)
GDP – real growth rate:
1.6% (2013 est.)
country comparison to the world: 157
3% (2012 est.)
1.3% (2011 est.)
GDP – per capita (PPP):
$55,400 (2013 est.)
country comparison to the world: 9
$55,100 (2012 est.)
$54,200 (2011 est.)
note: data are in 2013 US dollars
Gross national saving:
38.2% of GDP (2013 est.)
country comparison to the world: 13
39.4% of GDP (2012 est.)
37% of GDP (2011 est.)
GDP – composition, by end use:
household consumption: 40.5%
government consumption: 21.6%
investment in fixed capital: 21.7%
investment in inventories: 3.4%
exports of goods and services: 39.9%
imports of goods and services: -27.1%
(2013 est.)
GDP – composition, by sector of origin:
agriculture: 1.2%
industry: 42.3%
services: 56.5% (2013 est.)
Agriculture – products:
barley, wheat, potatoes; pork, beef, veal, milk; fish
Industries:
petroleum and gas, food processing, shipbuilding, pulp and paper products, metals, chemicals, timber, mining, textiles, fishing
Industrial production growth rate:
-3% (2013 est.)
country comparison to the world: 184
Labor force:
2.707 million (2014 est.)
country comparison to the world: 109
Labor force – by occupation:
agriculture: 2.2%
industry: 20.2%
services: 77.6% (2012)
Unemployment rate:
3.6% (2013 est.)
country comparison to the world: 28
3.2% (2012 est.)
Population below poverty line:
NA%
Household income or consumption by percentage share:
lowest 10%: 3.9%
highest 10%: 21% (2008)
Distribution of family income – Gini index:
25 (2008)
country comparison to the world: 135
25.8 (1995)
Budget:
revenues: $292.8 billion
expenditures: $225 billion (2013 est.)
Taxes and other revenues:
56.8% of GDP (2013 est.)
country comparison to the world: 6
Budget surplus (+) or deficit (-):
13.1% of GDP (2013 est.)
country comparison to the world: 4
Public debt:
30.1% of GDP (2013 est.)
country comparison to the world: 123
29.1% of GDP (2012 est.)
note: data cover general government debt, and includes debt instruments issued (or owned) by government entities other than the treasury; the data exclude treasury debt held by foreign entities; the data exclude debt issued by subnational entities, as well as intra-governmental debt; intra-governmental debt consists of treasury borrowings from surpluses in the social funds, such as for retirement, medical care, and unemployment; debt instruments for the social funds are not sold at public auctions
Fiscal year:
calendar year
Inflation rate (consumer prices):
1.9% (2013 est.)
country comparison to the world: 66
0.7% (2012 est.)
Central bank discount rate:
6.25% (31 December 2010 est.)
country comparison to the world: 115
1.75% (31 December 2009 est.)
Commercial bank prime lending rate:
NA% (31 December 2013 est.)
country comparison to the world: 160
3.7% (31 December 2012 est.)
Stock of narrow money:
$146.3 billion (31 December 2013 est.)
country comparison to the world: 27
$152.1 billion (31 December 2012 est.)
Stock of broad money:
$312.9 billion (31 December 2013 est.)
country comparison to the world: 30
$318.5 billion (31 December 2012 est.)
Stock of domestic credit:
$706.4 billion (31 December 2013 est.)
country comparison to the world: 21
$705.4 billion (31 December 2012 est.)
Market value of publicly traded shares:
$252.9 billion (31 December 2012 est.)
country comparison to the world: 28
$219.2 billion (31 December 2011)
$250.9 billion (31 December 2010 est.)
Current account balance:
$67.4 billion (2013 est.)
country comparison to the world: 6
$71.87 billion (2012 est.)
Exports:
$154.2 billion (2013 est.)
country comparison to the world: 33
$166 billion (2012 est.)
Exports – commodities:
petroleum and petroleum products, machinery and equipment, metals, chemicals, ships, fish
Exports – partners:
UK 25.6%, Germany 12.6%, Netherlands 12%, France 6.7%, Sweden 6.3%, US 5% (2012)
Imports:
$90.14 billion (2013 est.)
country comparison to the world: 36
$89.05 billion (2012 est.)
Imports – commodities:
machinery and equipment, chemicals, metals, foodstuffs
Imports – partners:
Sweden 13.6%, Germany 12.4%, China 9.3%, Denmark 6.3%, UK 6.1%, US 5.4% (2012)
Reserves of foreign exchange and gold:
$51.86 billion (31 December 2012 est.)
country comparison to the world: 38
$49.4 billion (31 December 2011 est.)
Debt – external:
$720.6 billion (31 December 2012 est.)
country comparison to the world: 21
$595.7 billion (31 December 2011)
note: Norway is a net external creditor
Stock of direct foreign investment – at home:
$274.5 billion (31 December 2013 est.)
country comparison to the world: 21
$256.8 billion (31 December 2012 est.)
Stock of direct foreign investment – abroad:
$264.3 billion (31 December 2013 est.)
country comparison to the world: 20
$241.3 billion (31 December 2012 est.)
Exchange rates:
Norwegian kroner (NOK) per US dollar –
5.802 (2013 est.)
5.8162 (2012 est.)
6.0442 (2010 est.)
6.288 (2009)
5.6361 (2008)
Cincinnati Connection

Check back soon for more!